All Case Studies
Flagship Result — Local + E-Commerce
98,000 Organic Clicks and $256,965 in Monthly Revenue
Combined local + e-commerce SEO engagement — the strongest result set in our portfolio
98K
Clicks
6-month trend
3.24M
Impressions
6-month trend
$256.9K
Monthly Revenue
+54.6%
3%
Avg. CTR
Project Overview
This is the strongest result set in our portfolio: a combined local and e-commerce SEO engagement that grew across every metric we track, search visibility, click-through rate, ranking position, and revenue. Over 6 months, organic clicks grew from 68K to 98K and impressions grew from 2.24M to 3.24M, while average position nearly doubled, improving from 17 to 8.5. On the revenue side, the store hit $256,965.50 in monthly revenue, up 54.6% month over month, with orders up 52.86%, direct, measurable proof that the organic growth converted into serious business revenue.
The Challenge
- Average ranking position sat at 17 six months prior, well outside page 1 for most competitive terms.
- Store revenue growth had plateaued, and traffic gains weren't reliably converting into proportional order growth.
- Needed a strategy covering both local search visibility and e-commerce conversion performance simultaneously, not two disconnected efforts.
Our Solution & Engineering Approach
1
Technical & On-Page SEO at Scale
Systematic technical fixes and on-page optimization across the highest-opportunity pages, prioritized by search volume and current ranking proximity to page 1.
2
Click-Through Rate Optimization
Rewrote titles and meta descriptions specifically to improve CTR, not just rankings, pushing average CTR to 2.6-3% versus a typical 1-2% benchmark.
3
E-Commerce Conversion Alignment
Aligned SEO-driven landing pages with actual purchase intent, ensuring the growing organic traffic had a clear, frictionless path to checkout.
4
Continuous Iteration Across Timeframes
Monitored performance across 24-hour, weekly, monthly, and quarterly windows to catch both immediate wins and long-term compounding trends.
Performance Data
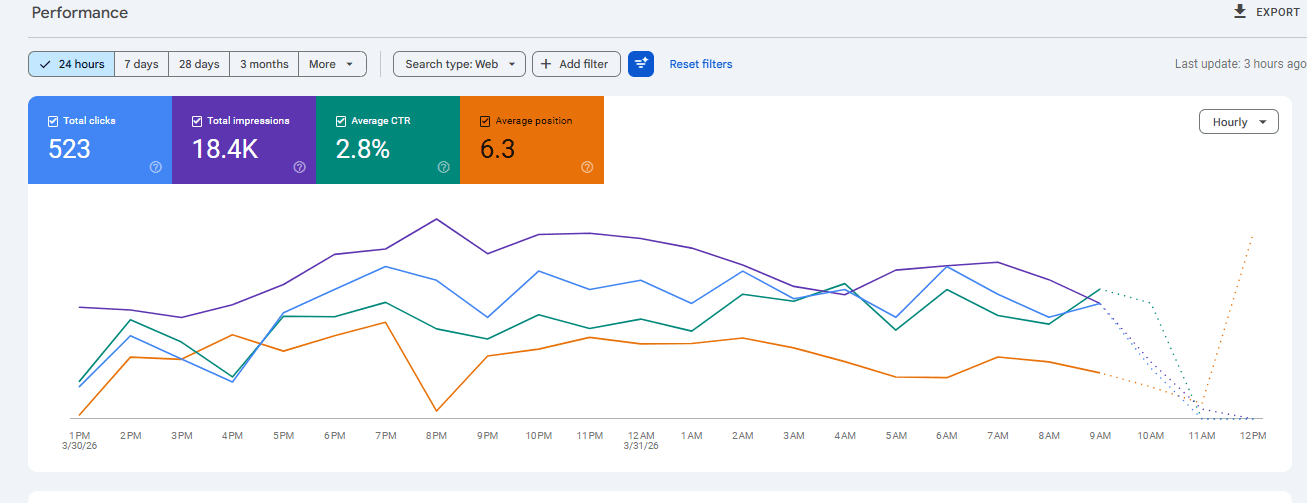
Last 24 Hours: 523 clicks, 2.8% CTR, position 6.3
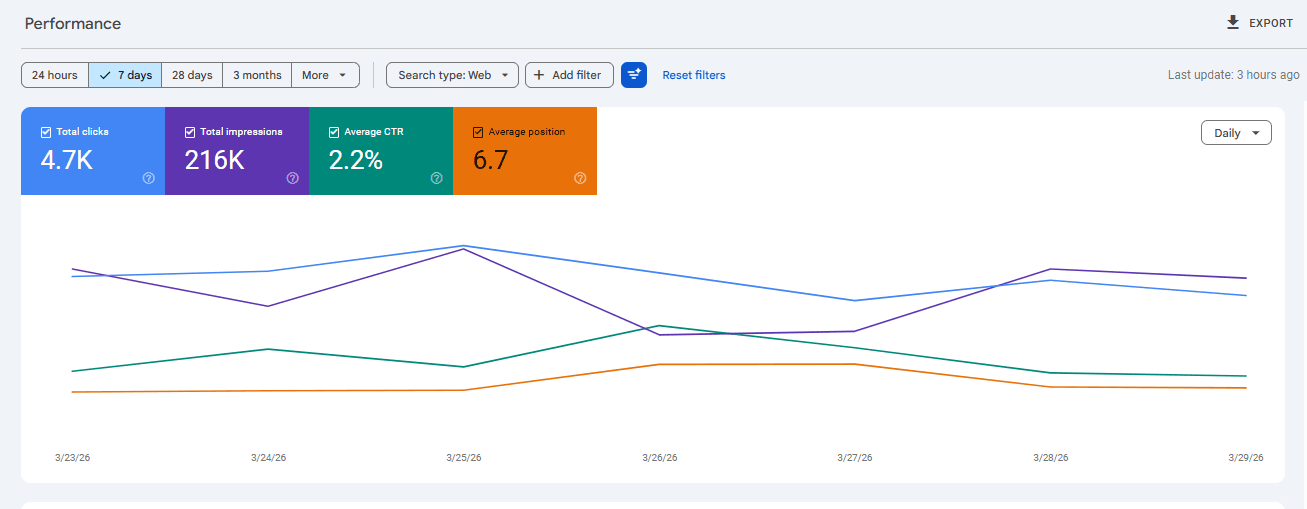
Last 7 Days: 4.7K clicks, 216K impressions, position 6.7
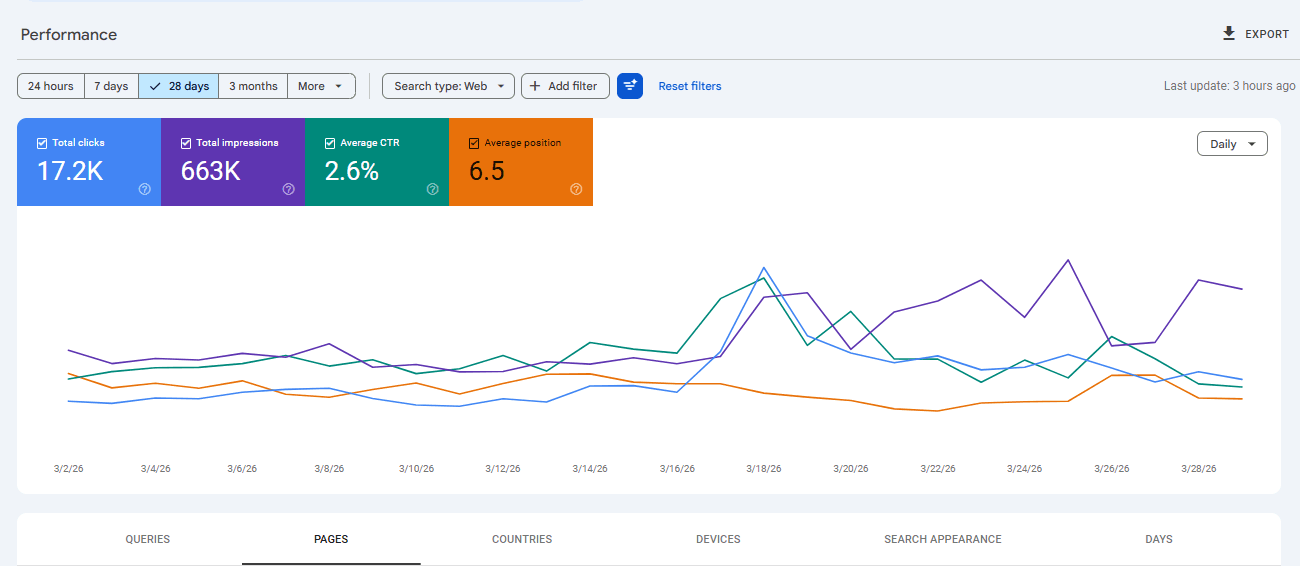
Last 28 Days: 17.2K clicks, 663K impressions, 2.6% CTR
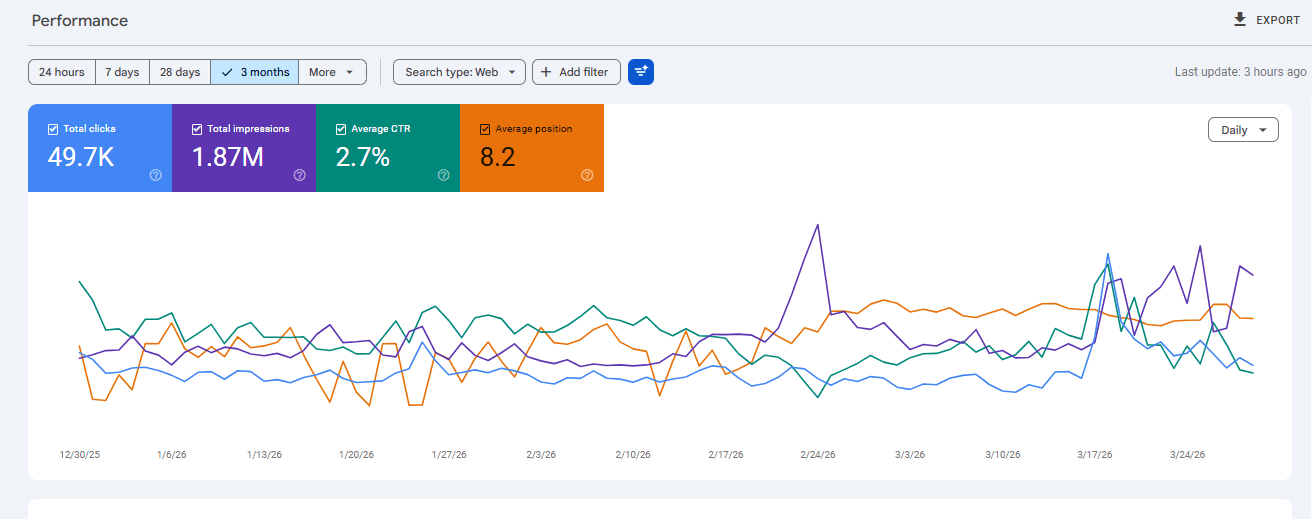
Last 3 Months: 49.7K clicks, 1.87M impressions, 2.7% CTR
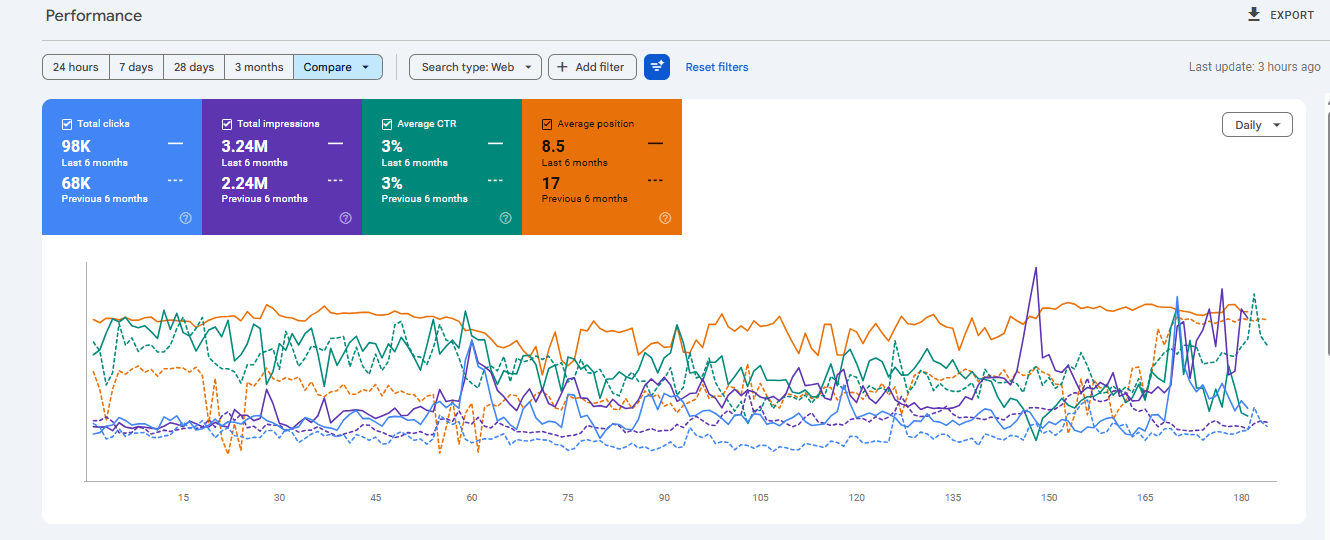
6-Month Trend: 98K clicks (up from 68K), position improved from 17 to 8.5
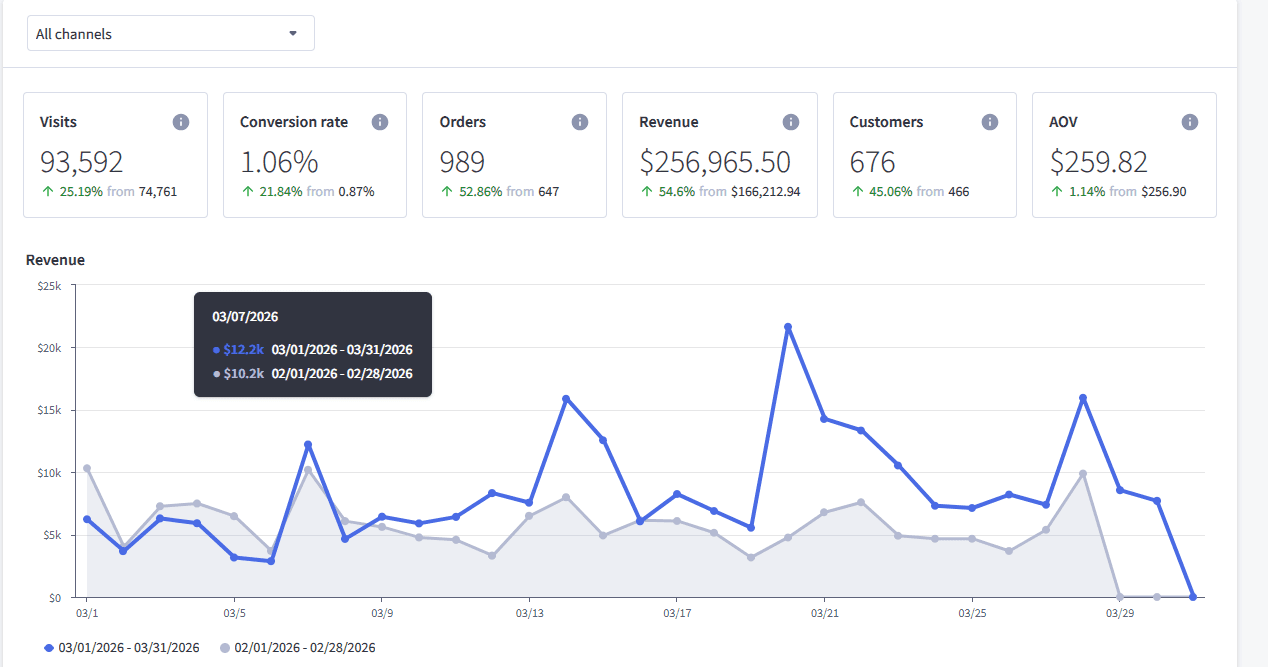
E-Commerce Store Overview, March 2026: $256,965.50 revenue, +54.6% month over month
The Outcome
- Organic clicks grew from 68K to 98K over 6 months.
- Impressions grew from 2.24M to 3.24M over the same period.
- Average ranking position nearly doubled, improving from 17 to 8.5.
- Click-through rate held at an exceptional 2.6-3% across every reporting window, well above the typical 1-2% industry benchmark.
- E-commerce revenue hit $256,965.50 for the month, up 54.6%, with orders up 52.86% and new customers up 45.06%.
98K
6-Month Clicks
$256.9K
Monthly Revenue
17 → 8.5
Position Improvement
989
Monthly Orders
Experience the Live Project
Explore the live website or discuss your own custom digital platform, web application, or SEO strategy with our engineering team.